
The scale is global.
The next step is material.
Behind every waste statistic is a material that could have had another future.
Explore the geography of plastic waste, the gaps in recycling and the complexity inside the materials we discard. Understanding the problem is the starting point for a better recovery pathway.
Explore the globe ↓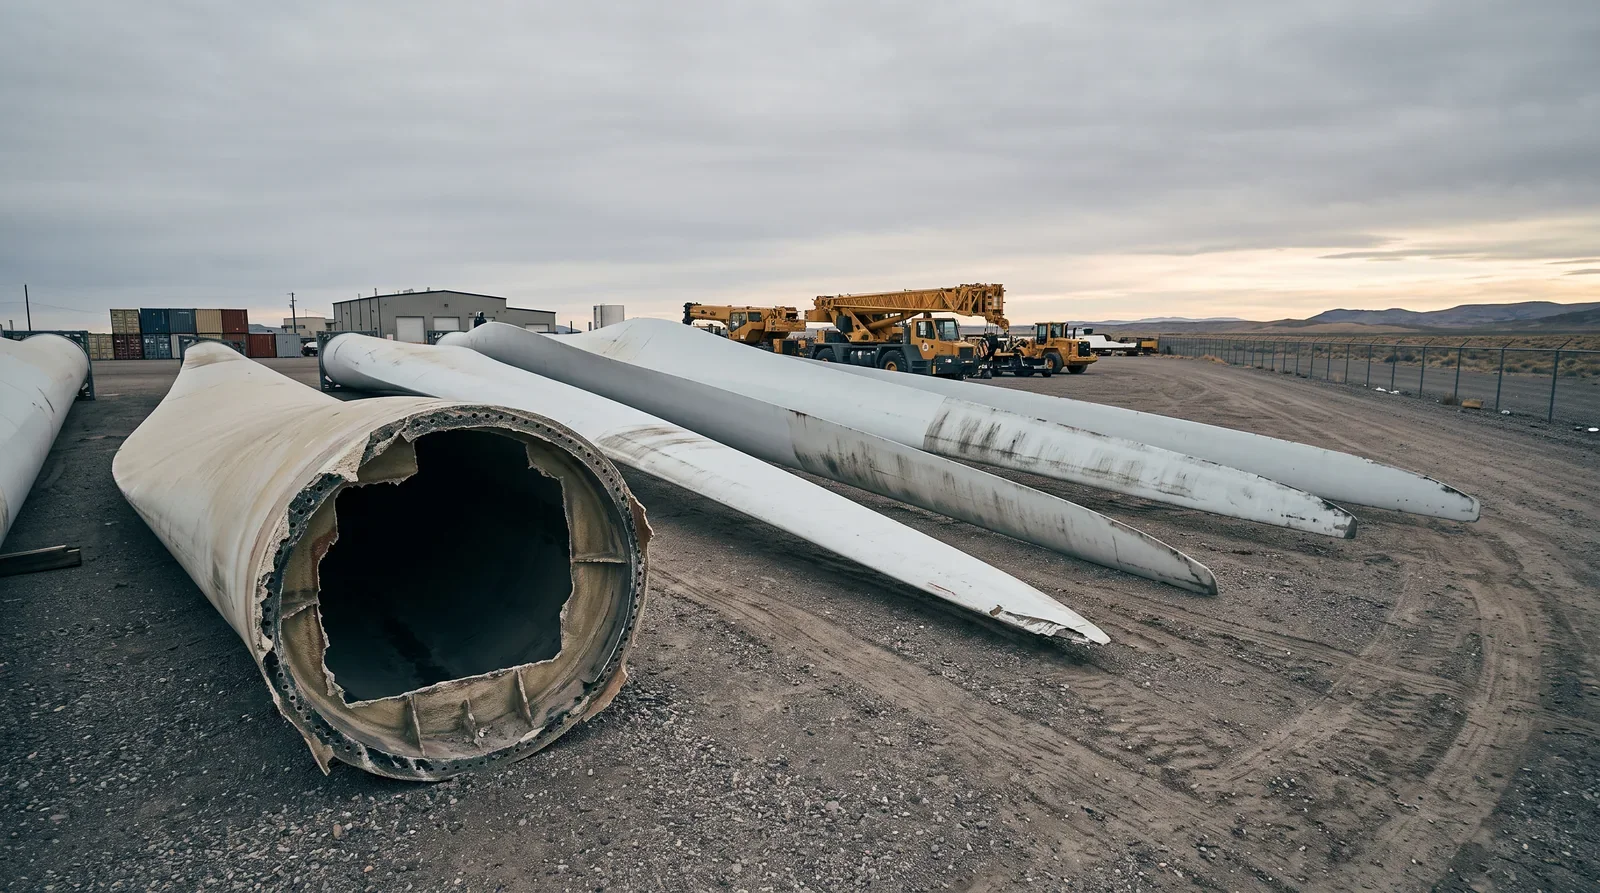
Ultimately recycled.
OECD estimated that only 9% of global plastic waste became recycled material after processing losses.
OECD · Global Plastics Outlook (2022) ↗Discarded electronics.
The world generated an estimated 62 million metric tonnes of electronic waste in 2022.
ITU / UNITAR · Global E-waste Monitor 2024 ↗Documented formal recovery.
That share of e-waste was documented as formally collected and recycled in an environmentally sound manner.
ITU / UNITAR · Global E-waste Monitor 2024 ↗Historical research snapshots, not live counters. Different waste categories and study scopes should not be combined. Mt means million metric tonnes.
One planet.
Many recovery challenges.
Rotate the globe, choose a continent and explore a country. Open the United States to compare all 50 states.
Drag with a mouse or use the arrow keys. All locations are also available in the selectors. Small islands may not appear at this map scale.
A country-by-country view.
country and territory profiles
Choose a continent or country to see estimated municipal plastic waste generation in 2020.
Cottom et al. (2024), processed by Our World in Data ↗
Municipal plastic waste only. These model-based estimates exclude several industrial and other waste sources. Missing values are not zero.
Country profiles use 2020 municipal plastic estimates. State profiles use 2021 packaging recycling estimates from the 2023 Ball / Eunomia report. They measure different things and cannot be compared directly.
Collected does not
always mean recovered.
OECD’s 2019 estimates show a large gap between plastic waste generation and final recycling. Disposal routes differ by region.
| Region | Distribution | Recycled | Incinerated | Landfilled | Mismanaged |
|---|---|---|---|---|---|
| Americas (excl. USA) | 9.6 | 1.2 | 60.1 | 29.2 | |
| Asia (excl. China and India) | 8.4 | 18.5 | 39.4 | 33.7 | |
| China | 12.8 | 23.8 | 36.4 | 27.1 | |
| Europe | 12.4 | 37.7 | 44.2 | 5.7 | |
| India | 13.3 | 4.2 | 36.3 | 46.2 | |
| Middle East & North Africa | 5.4 | 0.6 | 54.1 | 39.8 | |
| Oceania | 6.9 | 11.5 | 74.9 | 6.8 | |
| Sub-Saharan Africa | 5.7 | 0.5 | 30.2 | 63.6 | |
| United States | 4.5 | 19.1 | 72.9 | 3.6 | |
| World | 9.3 | 19.0 | 49.2 | 22.5 |
OECD (2023), processed by Our World in Data ↗ · Figures may not total 100% after rounding. OECD regions differ from the globe’s continent groupings. “Mismanaged” includes uncontrolled disposal; it does not mean all that material enters the ocean.
Complex by design.
Difficult at end of life.
Volume is only part of the problem. Materials bonded, blended or layered together require a recovery approach suited to their composition.
Tires & rubber
Rubber, reinforcing steel and textile fibers are combined for strength. Recovering useful fractions means addressing that combination.
Explore the recovery story →Lithium-ion batteries
A cell contains active materials, foils, separators and electrolyte. Recovery requires suitable preparation, safety controls and separation.
Explore the recovery story →E-waste
Metals, plastics, glass and circuit boards arrive in many forms. Reuse, controlled dismantling and material recovery each have a role.
Explore the recovery story →Solar panels
Glass, encapsulants, cells and metal contacts are laminated into a durable product. End-of-life recovery must address those layers.
Explore the recovery story →Wind turbine blades
Long-life fiber-reinforced composites are built to withstand demanding conditions. That durability creates a separation challenge.
Explore the recovery story →Construction debris
Mixed mineral, wood, metal and polymer fractions need characterization and sorting before suitable recovery routes can be chosen.
Explore the recovery story →Artificial turf & carpet
Fibers, backing, binders and infill complicate the recovery of individual materials from the finished system.
Explore the recovery story →Hard-to-recycle plastics
Mixed polymers, additives, contamination and multilayer structures can limit the quality and uses of recovered output.
Explore the recovery story →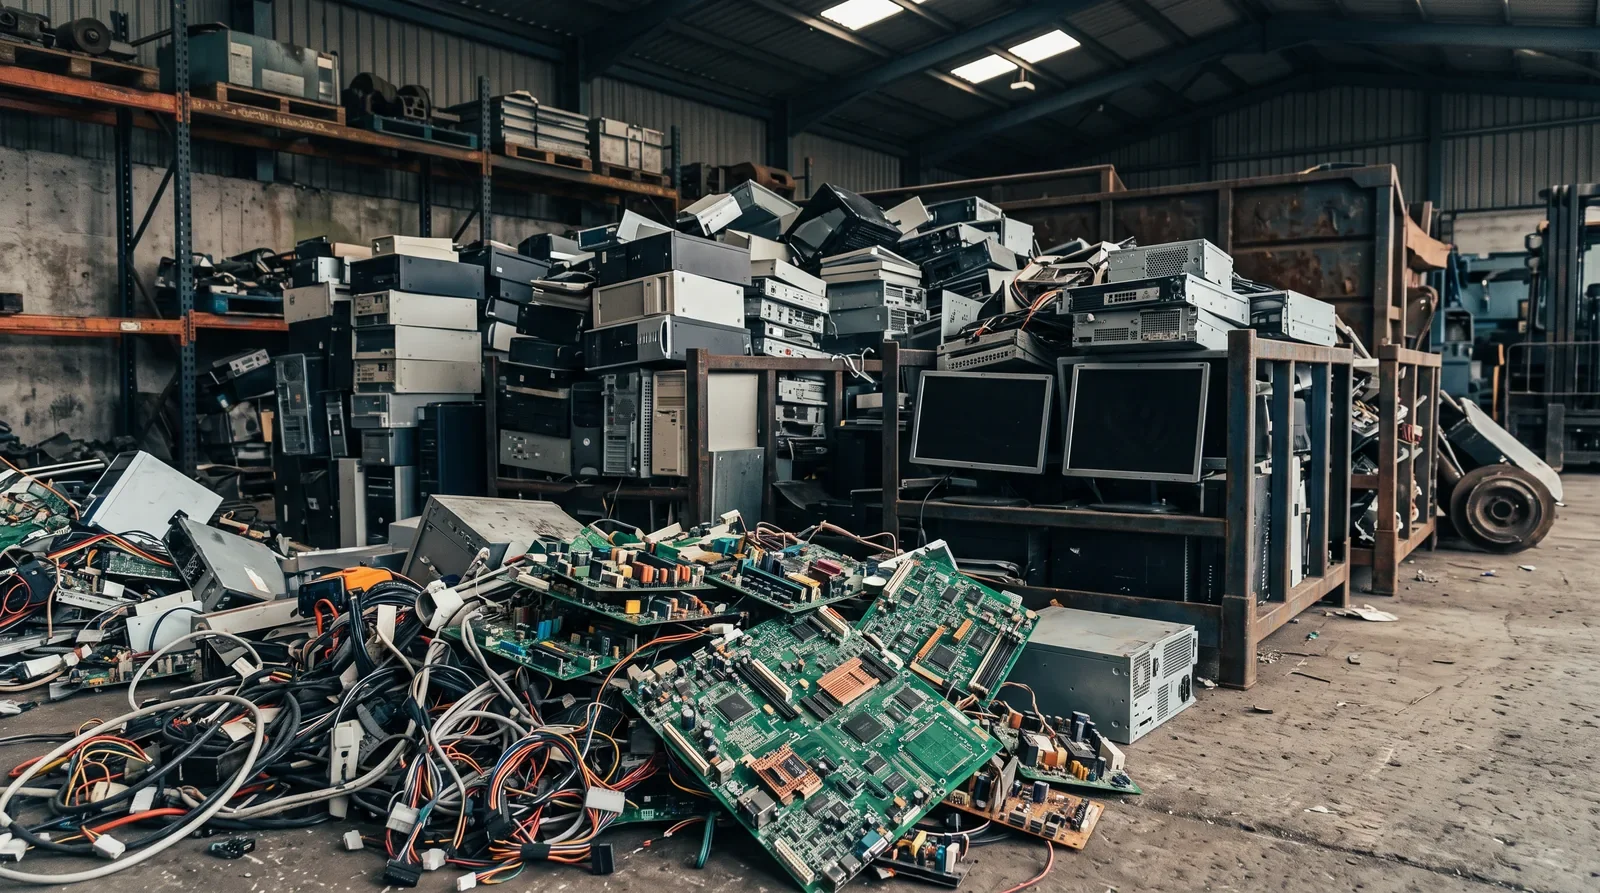
What if more of
the value stayed in use?
JENROVA’s focus is dry material liberation: opening complex material structures so suitable fractions can move toward separation, qualification and a useful next life.
The broader goal is to reduce what remains for disposal, including difficult residual fractions. The outcome starts with the feedstock and is established through evaluation, testing and appropriate downstream routes.
Explore our technology →Sources, dates & coverage.
Country and continent explorer
241 supplied country and territory profiles, using 2020 municipal plastic waste estimates from Cottom et al. (2024), processed by Our World in Data. All 241 figures matched the source download checked in November 2026. Continent totals shown here sum the listed profiles; they are not the publisher’s complete regional aggregates. The geographic groupings follow Our World in Data, with Svalbard and Jan Mayen assigned to Europe.
These are model estimates, displayed with rounding. They cover municipal plastic waste, not all plastic waste or all waste streams. The model excludes textile, electronic and several other sources. Antarctica has no estimate in this dataset.
Original research · Nature (2024) ↗Country data and definitions · Our World in Data ↗
Continent groupings · Our World in Data ↗
All 50 U.S. states
The 2023 Ball / Eunomia “50 States of Recycling” assessment uses 2021 data. Overall packaging rates here exclude fibers, films and flexible packaging. The rigid-plastics figure is a separate material-specific measure. These are recycling rates, not waste tonnage, and do not describe every material discarded in a state.
State-level coverage is for the United States only. The source report explains the methodology, estimates and limitations.
50 States of Recycling · Ball / Eunomia (2023) ↗Global and regional context
The 9% headline is OECD’s rounded 2019 global estimate. The regional table uses the OECD (2023) dataset distributed by Our World in Data; its world value rounds to 9.3%. The 2022 electronics figures come from ITU / UNITAR’s Global E-waste Monitor 2024. Each series has its own scope and methodology.
Global Plastics Outlook · OECD (2022) ↗Regional plastic waste fate · OECD / OWID ↗
Global E-waste Monitor 2024 · ITU / UNITAR ↗
What these facts establish
These studies describe industry challenges. They do not establish JENROVA’s recovery rates, throughput, emissions reductions or acceptance of a particular waste. Those outcomes depend on the specific material, preparation and process route.
Geographic outlines are simplified for navigation. They do not express a position on borders or sovereignty. World and U.S. map geometry: Natural Earth / world-atlas and U.S. Census / us-atlas.
Discuss a specific material →Read all country and territory estimates · 2020
| Location | Continent | Tonnes |
|---|---|---|
| Afghanistan | Asia | 862,019 |
| Aland Islands | Europe | 2,062 |
| Albania | Europe | 130,912 |
| Algeria | Africa | 1,476,879 |
| American Samoa | Oceania | 1,981 |
| Andorra | Europe | 6,327 |
| Angola | Africa | 975,901 |
| Anguilla | North America | 528 |
| Antigua and Barbuda | North America | 6,984 |
| Argentina | South America | 2,405,453 |
| Armenia | Asia | 105,297 |
| Aruba | North America | 9,607 |
| Australia | Oceania | 1,398,883 |
| Austria | Europe | 601,222 |
| Azerbaijan | Asia | 345,964 |
| Bahamas | North America | 33,869 |
| Bahrain | Asia | 81,656 |
| Bangladesh | Asia | 3,252,684 |
| Barbados | North America | 21,147 |
| Belarus | Europe | 449,109 |
| Belgium | Europe | 635,846 |
| Belize | North America | 29,059 |
| Benin | Africa | 234,417 |
| Bermuda | North America | 3,760 |
| Bhutan | Asia | 12,456 |
| Bolivia | South America | 333,918 |
| Bonaire Sint Eustatius and Saba | North America | 2,161 |
| Bosnia and Herzegovina | Europe | 120,233 |
| Botswana | Africa | 106,754 |
| Brazil | South America | 8,787,108 |
| British Virgin Islands | North America | 2,745 |
| Brunei | Asia | 43,226 |
| Bulgaria | Europe | 279,790 |
| Burkina Faso | Africa | 256,412 |
| Burundi | Africa | 188,893 |
| Cambodia | Asia | 847,956 |
| Cameroon | Africa | 694,791 |
| Canada | North America | 1,902,931 |
| Cape Verde | Africa | 23,695 |
| Cayman Islands | North America | 5,222 |
| Central African Republic | Africa | 66,146 |
| Chad | Africa | 283,497 |
| Chile | South America | 1,085,407 |
| China | Asia | 41,302,464 |
| Christmas Island | Asia | 96 |
| Cocos Islands | Asia | 15 |
| Colombia | South America | 1,771,952 |
| Comoros | Africa | 19,147 |
| Congo | Africa | 146,110 |
| Cook Islands | Oceania | 1,513 |
| Costa Rica | North America | 212,079 |
| Cote d'Ivoire | Africa | 577,943 |
| Croatia | Europe | 261,200 |
| Cuba | North America | 563,662 |
| Curacao | North America | 16,179 |
| Cyprus | Europe | 68,998 |
| Czechia | Europe | 592,351 |
| Democratic Republic of Congo | Africa | 1,296,947 |
| Denmark | Europe | 324,221 |
| Djibouti | Africa | 33,214 |
| Dominica | North America | 3,509 |
| Dominican Republic | North America | 399,109 |
| East Timor | Asia | 28,562 |
| Ecuador | South America | 746,183 |
| Egypt | Africa | 3,253,851 |
| El Salvador | North America | 225,957 |
| Equatorial Guinea | Africa | 69,864 |
| Eritrea | Africa | 63,934 |
| Estonia | Europe | 84,474 |
| Eswatini | Africa | 28,974 |
| Ethiopia | Africa | 926,463 |
| Falkland Islands | South America | 277 |
| Faroe Islands | Europe | 3,325 |
| Fiji | Oceania | 29,303 |
| Finland | Europe | 319,762 |
| France | Europe | 4,278,314 |
| French Guiana | South America | 16,112 |
| French Polynesia | Oceania | 23,075 |
| Gabon | Africa | 76,503 |
| Gambia | Africa | 44,911 |
| Georgia | Asia | 169,526 |
| Germany | Europe | 4,128,099 |
| Ghana | Africa | 861,903 |
| Gibraltar | Europe | 1,707 |
| Greece | Europe | 609,193 |
| Greenland | North America | 2,483 |
| Grenada | North America | 6,785 |
| Guadeloupe | North America | 21,166 |
| Guam | Oceania | 14,517 |
| Guatemala | North America | 484,507 |
| Guernsey | Europe | 3,468 |
| Guinea | Africa | 131,711 |
| Guinea-Bissau | Africa | 34,944 |
| Guyana | South America | 27,530 |
| Haiti | North America | 309,003 |
| Honduras | North America | 255,444 |
| Hong Kong | Asia | 678,698 |
| Hungary | Europe | 664,162 |
| Iceland | Europe | 19,453 |
| India | Asia | 27,781,626 |
| Indonesia | Asia | 8,142,920 |
| Iran | Asia | 2,876,161 |
| Iraq | Asia | 1,798,257 |
| Ireland | Europe | 277,402 |
| Isle of Man | Europe | 3,895 |
| Israel | Asia | 511,846 |
| Italy | Europe | 3,995,201 |
| Jamaica | North America | 128,664 |
| Japan | Asia | 5,867,852 |
| Jersey | Europe | 5,993 |
| Jordan | Asia | 589,710 |
| Kazakhstan | Asia | 778,540 |
| Kenya | Africa | 955,894 |
| Kiribati | Oceania | 2,002 |
| Kuwait | Asia | 369,224 |
| Kyrgyzstan | Asia | 292,542 |
| Laos | Asia | 177,380 |
| Latvia | Europe | 123,062 |
| Lebanon | Asia | 227,622 |
| Lesotho | Africa | 55,644 |
| Liberia | Africa | 85,815 |
| Libya | Africa | 199,127 |
| Liechtenstein | Europe | 1,694 |
| Lithuania | Europe | 175,037 |
| Luxembourg | Europe | 34,092 |
| Macao | Asia | 56,262 |
| Madagascar | Africa | 307,317 |
| Malawi | Africa | 223,591 |
| Malaysia | Asia | 1,529,667 |
| Maldives | Asia | 19,789 |
| Mali | Africa | 277,019 |
| Malta | Europe | 34,754 |
| Marshall Islands | Oceania | 1,199 |
| Martinique | North America | 17,797 |
| Mauritania | Africa | 110,389 |
| Mauritius | Africa | 57,632 |
| Mayotte | Africa | 13,755 |
| Mexico | North America | 5,755,279 |
| Micronesia (country) | Oceania | 2,106 |
| Moldova | Europe | 68,187 |
| Monaco | Europe | 2,980 |
| Mongolia | Asia | 115,386 |
| Montenegro | Europe | 42,867 |
| Montserrat | North America | 324 |
| Morocco | Africa | 1,259,027 |
| Mozambique | Africa | 477,724 |
| Myanmar | Asia | 1,443,709 |
| Namibia | Africa | 84,390 |
| Nauru | Oceania | 914 |
| Nepal | Asia | 510,593 |
| Netherlands | Europe | 862,288 |
| New Caledonia | Oceania | 22,692 |
| New Zealand | Oceania | 370,461 |
| Nicaragua | North America | 198,106 |
| Niger | Africa | 185,715 |
| Nigeria | Africa | 5,619,360 |
| Niue | Oceania | 57 |
| Norfolk Island | Oceania | 165 |
| North Korea | Asia | 653,267 |
| North Macedonia | Europe | 89,785 |
| Northern Mariana Islands | Oceania | 4,405 |
| Norway | Europe | 230,503 |
| Oman | Asia | 247,602 |
| Pakistan | Asia | 4,939,341 |
| Palau | Oceania | 808 |
| Palestine | Asia | 206,322 |
| Panama | North America | 177,084 |
| Papua New Guinea | Oceania | 206,809 |
| Paraguay | South America | 304,800 |
| Peru | South America | 1,227,814 |
| Philippines | Asia | 3,552,568 |
| Poland | Europe | 2,069,654 |
| Portugal | Europe | 581,288 |
| Puerto Rico | North America | 226,061 |
| Qatar | Asia | 206,874 |
| Reunion | Africa | 51,601 |
| Romania | Europe | 666,057 |
| Russia | Europe | 6,099,985 |
| Rwanda | Africa | 272,681 |
| Saint Barthelemy | North America | 562 |
| Saint Helena | Africa | 177 |
| Saint Kitts and Nevis | North America | 4,173 |
| Saint Lucia | North America | 10,153 |
| Saint Martin (French part) | North America | 1,628 |
| Saint Pierre and Miquelon | North America | 396 |
| Saint Vincent and the Grenadines | North America | 5,060 |
| Samoa | Oceania | 7,249 |
| San Marino | Europe | 2,623 |
| Sao Tome and Principe | Africa | 7,325 |
| Saudi Arabia | Asia | 2,708,362 |
| Senegal | Africa | 354,775 |
| Serbia | Europe | 353,005 |
| Seychelles | Africa | 8,835 |
| Sierra Leone | Africa | 92,388 |
| Singapore | Asia | 372,438 |
| Sint Maarten (Dutch part) | North America | 3,432 |
| Slovakia | Europe | 371,777 |
| Slovenia | Europe | 121,793 |
| Solomon Islands | Oceania | 12,957 |
| Somalia | Africa | 316,351 |
| South Africa | Africa | 2,396,126 |
| South Korea | Asia | 2,510,347 |
| South Sudan | Africa | 348,357 |
| Spain | Europe | 3,476,915 |
| Sri Lanka | Asia | 764,507 |
| Sudan | Africa | 1,094,955 |
| Suriname | South America | 24,303 |
| Svalbard and Jan Mayen | Europe | 194 |
| Sweden | Europe | 477,876 |
| Switzerland | Europe | 376,108 |
| Syria | Asia | 706,506 |
| Taiwan | Asia | 1,464,812 |
| Tajikistan | Asia | 278,436 |
| Tanzania | Africa | 1,174,969 |
| Thailand | Asia | 3,427,886 |
| Togo | Africa | 154,634 |
| Tokelau | Oceania | 21 |
| Tonga | Oceania | 3,551 |
| Trinidad and Tobago | North America | 93,659 |
| Tunisia | Africa | 435,761 |
| Turkey | Asia | 4,034,216 |
| Turkmenistan | Asia | 202,767 |
| Turks and Caicos Islands | North America | 3,491 |
| Tuvalu | Oceania | 326 |
| Uganda | Africa | 858,273 |
| Ukraine | Europe | 1,430,222 |
| United Arab Emirates | Asia | 1,022,618 |
| United Kingdom | Europe | 3,669,760 |
| United States | North America | 24,973,222 |
| United States Virgin Islands | North America | 7,839 |
| Uruguay | South America | 198,388 |
| Uzbekistan | Asia | 1,040,546 |
| Vanuatu | Oceania | 9,580 |
| Vatican | Europe | 56 |
| Venezuela | South America | 1,403,342 |
| Vietnam | Asia | 3,644,427 |
| Wallis and Futuna | Oceania | 155 |
| Western Sahara | Africa | 16,002 |
| Yemen | Asia | 906,766 |
| Zambia | Africa | 314,621 |
| Zimbabwe | Africa | 212,875 |
Read all 50 U.S. state profiles · 2021
| State | Packaging, excluding fibers, films and flexibles (%) | Rigid plastics (%) |
|---|---|---|
| Alabama | 8 | 5 |
| Alaska | 6 | 2 |
| Arizona | 12 | 10 |
| Arkansas | 11 | 7 |
| California | 41 | 30 |
| Colorado | 11 | 10 |
| Connecticut | 39 | 28 |
| Delaware | 26 | 17 |
| Florida | 17 | 7 |
| Georgia | 14 | 9 |
| Hawaii | 22 | 22 |
| Idaho | 13 | 11 |
| Illinois | 19 | 10 |
| Indiana | 24 | 19 |
| Iowa | 45 | 17 |
| Kansas | 23 | 13 |
| Kentucky | 11 | 7 |
| Louisiana | 4 | 5 |
| Maine | 65 | 48 |
| Maryland | 33 | 23 |
| Massachusetts | 48 | 27 |
| Michigan | 40 | 22 |
| Minnesota | 37 | 20 |
| Mississippi | 6 | 4 |
| Missouri | 22 | 12 |
| Montana | 12 | 10 |
| Nebraska | 11 | 12 |
| Nevada | 12 | 7 |
| New Hampshire | 23 | 23 |
| New Jersey | 39 | 30 |
| New Mexico | 16 | 17 |
| New York | 44 | 23 |
| North Carolina | 17 | 9 |
| North Dakota | 21 | 12 |
| Ohio | 16 | 9 |
| Oklahoma | 8 | 7 |
| Oregon | 45 | 31 |
| Pennsylvania | 20 | 10 |
| Rhode Island | 17 | 27 |
| South Carolina | 6 | 5 |
| South Dakota | 23 | 13 |
| Tennessee | 5 | 3 |
| Texas | 8 | 5 |
| Utah | 14 | 11 |
| Vermont | 51 | 35 |
| Virginia | 18 | 8 |
| Washington | 25 | 18 |
| West Virginia | 2 | 2 |
| Wisconsin | 26 | 12 |
| Wyoming | 12 | 10 |
Bring us your
recovery challenge.
Tell us about the stream, the location and the outcome you are working toward.